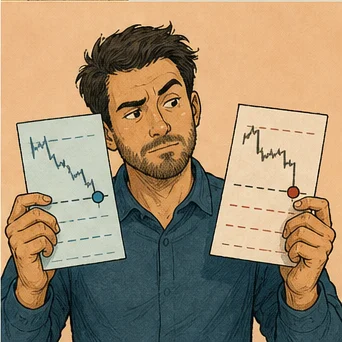

Correlated trades often create a silent trap for traders working within a prop firm challenge. You might open separate tickets in related currencies, indices, or commodities, thinking you are diversifying your portfolio across different charts. In reality, these trades often move in lockstep because they respond to the same macro events. If your daily loss limit is tight, this hidden concentration can lead to a single market shock causing a catastrophic failure of your evaluation.
Correlation is never static or perfectly measurable. A relationship that held up for months might suddenly vanish or even reverse during a period of intense market stress. Because of this, the practical challenge involves conservative exposure management rather than trying to calculate complex statistical models. The most reliable approach is to treat your positions as one single idea whenever a common driver exists. If a specific news item or economic theme could reasonably cause all your positions to lose money simultaneously, you must manage them as a single block of risk.
This article covers one part of the decision. The main prop firm passing service guide explains how correlated trades in a prop firm challenge connects with preparation, risk control, and the funded stage.
Identify Common Drivers
Everything starts with understanding why a market is moving. Is the current volatility caused by broad risk sentiment, a specific currency theme, interest rates, or a shift in energy prices? You might see two separate symbols on your screen, but that does not guarantee they provide any real diversification. If your trade thesis behind both positions is identical, then you are essentially doubling down on one prediction.
Consider the underlying drivers of your favorite assets. Gold, for instance, often responds to real interest rates and the value of the dollar. If you also trade a silver position or a currency pair heavily influenced by the dollar, you are stacking your risk on the same macro trend. Do not let the different names or ticker symbols fool you into thinking you are protected by having multiple assets in your account.
Recent market behavior provides valuable context, but it is not a permanent guarantee. Relationships between assets can strengthen, weaken, or even reverse without much warning. This is especially true during major economic releases or unexpected geopolitical events. When markets become stressed, correlation tends to move toward 1, meaning almost everything starts moving in the same direction at once. Plan for this worst-case scenario before you ever click the buy or sell button.
Think of this as identifying the heartbeat of the market. If you are trading the EUR/USD and the GBP/USD because both are rallying against the dollar, you are trading a single trend. The drivers are the same. If the dollar experiences a sudden surge due to a surprising inflation report, both your long positions will suffer at the same time. Recognizing this shared risk is the first step toward building a sustainable approach for a prop firm challenge.
View the Portfolio as One Position
You need to add up the maximum loss of every position that could potentially hit its stop at the same time and then compare that total against your daily loss budget. Most traders make the mistake of looking at each ticket in isolation. They see a 0.25% risk on one chart and think it is safe. Then they do it again on another, and again on a third. Suddenly, they have 0.75% risk tied to a single macro outcome.
A true portfolio view removes the false sense of comfort that comes from seeing several small, individual risk amounts. When you look at your platform, ask yourself what happens if the main theme turns against you. If all your trades are tied to the same idea, they will likely stop out together. Seeing this combined total is the only way to ensure you are staying within the rules of your account.
Consider a hypothetical example where you have a 1% daily loss limit. If you have 3 trades open that each risk 0.3% on a single economic driver, your total risk is actually 0.9%. You are incredibly close to your daily maximum. If a flash crash occurs or slippage hits during an event, you could easily blow through your limit in one minute. Managing as a portfolio forces you to acknowledge this reality before the trade actually happens.
This perspective requires you to be honest with yourself about your risk. You cannot just count the first ticket on your list. You must include open trades, pending orders, and even planned additions to your position size. If you cannot afford the loss of the combined block, you must reduce the size of the individual components. This is not about being fearful, but about respecting the hard limits that govern your ability to complete a challenge.
Set a Correlation Limit
Before you place any orders, define a maximum cash amount or a fixed percentage limit for any single theme. Do not just use your overall account limit for this. Instead, choose a number that is significantly lower than your maximum daily allowance. This provides a safety buffer for execution errors, unexpected spread expansion, or delayed exits. If the market moves fast, that buffer keeps you alive when things go wrong.
Consistency is the key to surviving the long term. You must apply this limit across every trading session, regardless of how you feel about a particular setup. It is very common for a trader to see a new, attractive chart after taking a loss and decide to increase their risk to catch up. This is a recovery decision, not a logical portfolio decision. It usually leads to a much faster exit from the program.
Think of this limit as a budget for an idea. If you decide that 0.5% is your total risk limit for a dollar-related trade, stick to that regardless of whether you have 1 trade or 3. If you really want to put on a second trade, you must divide that 0.5% between both of them. This keeps your exposure capped and prevents the temptation to ignore the correlation risk. Discipline in these rules distinguishes successful long-term traders.
Suppose you have a hypothetical limit of 0.4% per theme. You decide to trade the oil market because of a supply issue. You put 0.2% into a crude oil contract. If you find a correlated energy stock or another derivative, you can only allocate the remaining 0.2% to those positions combined. You have honored your correlation limit. By planning this out, you avoid the trap of chasing individual setups while ignoring the massive risk you have already built.

Allocate Risk Across Trades
When you find two valid setups that share the same macro driver, your job is to split the risk between them. Never give each one the full risk unit. If your standard risk per idea is 0.5%, do not put 0.5% into setup A and 0.5% into setup B. Instead, allocate 0.25% to each. You are expressing the same thesis twice. By splitting the risk, you maintain your overall exposure at a manageable level.
You should also allocate less capital to the weaker setup. If one chart has a very strong technical pattern and the other looks a bit fuzzy, give the bulk of your risk to the strong one. Alternatively, take only the single clearest expression of your thesis. There is rarely a need to pile into multiple correlated positions. Often, the best decision is to pick the one that gives you the best odds and ignore the rest.
Remember that equal lots do not mean equal risk. A standard lot of the EUR/USD behaves differently than a standard lot of the GBP/JPY. You must calculate the risk based on volatility and distance to your stop level. Even if you calculate your risk as an equal percentage, both stops can still be hit at the same time. Diversifying your symbols does not magically remove the correlation. Sizing accurately is the only way to manage that shared movement.
Imagine a situation where you have a bullish view on technology stocks. You see the Nasdaq and a popular semiconductor stock both moving upward. Instead of taking a full-size position in both, you split your risk. You assign 0.3% to the Nasdaq trade and 0.2% to the semiconductor stock. If the tech sector faces a sudden correction, you have only lost 0.5% of your account instead of risking a full 1% or more. This approach protects your challenge account from total destruction.
Manage Event Concentration
Scheduled economic data, central bank announcements, and surprise news headlines are the primary catalysts that force correlated markets to move together. Before you add any new exposure, check the calendar. You need to know if the prop firm restricts trading or holding during these high-impact periods. Being unaware of a major release can turn a routine, well-managed trade into a violation of your daily loss limit in mere seconds.
Do not fool yourself into thinking that staggered entries create independence. If you open one position at 9:00 am and another at 9:15 am, they are both still vulnerable to the 9:30 am economic release. You have essentially doubled your exposure right before the event. A liquidity gap or a broad repricing will hit both positions equally hard. Staggering your entries does not protect you from the underlying macro reality of the markets.
Some events are not on the calendar. A sudden speech by a world leader or an unexpected regional conflict can hit the wire at any time. When this happens, correlated assets react instantly. If you are heavily concentrated in one sector, your account will feel the impact across all your open positions simultaneously. Because of this, you should always keep your total portfolio exposure low enough to survive even a sudden, unexpected spike in volatility.
Take a look at the history of recent central bank meetings for your chosen assets. You will often see that interest rate decisions create massive, unified moves across entire asset classes. If you have five different currency pairs open, and all of them are correlated to the dollar, you effectively have one massive bet on the dollar. An event-driven move can trigger all your stops at once, creating a concentrated loss that effectively kills your account progress.
Related guide for Correlated Trades in a Prop Firm Challenge: A useful companion for this decision is Prop Firm Challenge Position Size Calculator Guide. Calculate quantity from a valid stop and cash risk, then confirm that the whole idea fits available drawdown, contract specifications, and real execution.
Treat Hedges Carefully
Many traders try to use hedges to manage their risk, but an apparent hedge is often incomplete. You might think that being long one asset and short a correlated asset protects you, but things like ratios, timing differences, and changing contract values can make this strategy fail. Hedging adds a layer of complexity and extra costs that often mask your true directional exposure. You might find you are still betting heavily on a specific outcome despite the hedge.
Always calculate the worst plausible outcome for your combined trades rather than just labeling them a hedge and walking away. If you do not understand the relationship between your two assets well enough to accurately size them and monitor them, you are probably better off avoiding the trade. Simpler exposure is almost always safer. If you cannot explain why the two assets should stay correlated, you should not be using them as a hedge.
Think about what happens if your hedge fails to move in the way you expected. Suppose you hold a long position in a commodity and a short position in a related equity. You assume they are inversely correlated. If the market experiences a massive, broad-based selloff, both the commodity and the equity might drop together. Your hedge is now failing you at the exact moment you need it most. This is a common failure case in volatile periods.
Complexity is the enemy of consistency in a challenge account. If you rely on a hedge, you have two potential points of failure instead of one. You must manage two entry points, two stop losses, and two exit strategies. If your understanding of the relationship between these assets is off, the hedge will actually increase your risk rather than lower it. Keep your trades straightforward so you can easily calculate your total exposure at any given moment.
Monitor Exposure During the Session
You must constantly recalculate your theme exposure throughout the trading day. This is vital after you get a partial fill, change your stop levels, or place new orders. A position that started as a small, insignificant allocation can quickly become a dangerous concentration if other legs of your trade are closed or if a correlated market starts to accelerate against you. Monitoring is an active process that requires you to stay alert to changes in your account.
Use alerts for your combined loss and your personal daily thresholds. Once these alerts trigger, you must act on them immediately. The goal of monitoring is to lead to a predefined reduction or a pause in your trading. It is not an invitation to start an improvised attempt to average into your losing trades. Averaging down into a correlated theme is the fastest way to hit your daily loss limit and fail your challenge.
Reviewing your exposure is a step you should perform after every single fill. If you are focused on a specific sector, ask yourself: how much of my total daily risk is currently tied up here? If the answer is more than your planned limit, you need to tighten your stops or exit a portion of the position immediately. Do not wait for the market to move against you to decide what to do. Have the plan ready.
Consider a hypothetical scenario where you have three correlated positions open. You have 0.2% risk on each. Suddenly, one of them hits a target and you take profit. Now your total risk is reduced, but the remaining two are still correlated. Do you add a new trade? Only if you have kept the math clear. Many traders make the mistake of assuming that profit gives them 'extra room' to risk more. That is how you lose discipline.

Review Correlation in the Journal
Record the common driver for each of your trades, the intended combined risk, the actual combined loss, and whether the markets behaved as you expected. This documentation helps you distinguish between a valid, expected loss and an unnoticed breach of your portfolio plan. If you find that your markets moved in ways that violated your assumptions, you have a signal that you need to adjust your strategy or look for different assets.
Review your patterns over a long enough period to improve your limits cautiously. Do not try to infer permanent relationships from a single week of charts. Markets change, and correlations are dynamic. Using a single week of favorable outcomes to justify a much larger future concentration is a classic error. Base your future decisions on a wide sample size of trades so you can see if your approach is actually working over time.
Keep your journal entries focused on the mechanics of your risk. Did you have too much invested in one sector? Did you fail to see the correlation between two different commodities? These are the questions that will help you grow as a trader. By keeping a detailed account of your decisions, you create a feedback loop that helps you identify weak spots in your logic before they turn into major losses for your account.
If you discover that you were consistently losing money on three separate trades that were all tied to the same central bank announcement, you have learned something valuable. You might conclude that you need to reduce your total sector exposure by 50% ahead of those specific events. This is the kind of insight that comes only from careful reflection. It is not just about keeping score, but about refining your process for the long haul.
Scaling Positions by Volatility
Raw position size often masks true risk in correlated assets. Two trades with identical dollar values can have vastly different impacts if one asset moves twice as much as the other. You must adjust your size based on the average daily range of each asset. Failing to do this means you might be over-leveraged on the more volatile instrument without realizing it.
Consider a hypothetical example involving 2 forex pairs tied to a single trend. Pair A moves 50 pips daily on average, while Pair B moves 100 pips daily. If you put the same dollar amount into both, Pair B carries double the actual market risk. Your stop loss on Pair B will likely be hit much faster during a minor fluctuation compared to Pair A.
To manage this, calculate your position size using the distance to your stop rather than a fixed lot count. Set your maximum risk for the combined theme, then divide that risk by the volatility of each specific asset. This ensures that even if both assets move significantly, your total account hit remains consistent with your initial plan.
Use a simple volatility multiplier to keep your math clean. If an asset is historically 1.5 times more volatile than your primary index, reduce your size in that asset by that same factor. This approach balances your exposure across the portfolio. It removes the bias toward assets that just happen to have larger nominal price movements.
Always update these volatility calculations during periods of market stress. When the market turns, the usual volatility ratios often break down. If you do not monitor these changes, your previously balanced portfolio might quickly become lopsided. Quick mental checks before entering a second position can prevent this common oversight.

Related guide for Correlated Trades in a Prop Firm Challenge: For the next practical part of your preparation, continue with Advanced Prop Firm Challenge Risk Management for Consistent Execution. Advanced risk management is not about taking more risk. It is about seeing the risk the account already has across positions, sessions, events, and changing volatility.
Accounting for Liquidity Gaps
Correlated trades are highly susceptible to liquidity gaps. This happens when price jumps from one level to another without trading at the prices in between. This is common during news events or market open times. If you hold several correlated positions, these gaps can push all your exit prices far beyond your stop levels simultaneously.
Think of a hypothetical scenario where you have 3 indices shorted. A major announcement causes a gap upward. Your stop loss for each index sits at a specific price, but because the market gapped, the broker fills your orders at the first available price far above your stops. You lose more than you planned because the market skipped over your order triggers.
To protect against this, keep your total size smaller than you think you need. Do not max out your risk for an idea when you know a gap event is possible. A buffer of 20% of your daily loss limit allows for these unexpected slippage events without triggering an account violation.
Avoid adding to your position right before the market closes or opens for the day. These windows often suffer from thin liquidity and are prone to large gaps. If you must have exposure during these times, accept that your risk is higher and adjust your total size downward accordingly. It is better to miss a small gain than to suffer a catastrophic gap loss.
Assume your stops will not work during extreme volatility. While you should still use them, your primary defense is your total position size across correlated assets. If you can survive a gap move without hitting your max daily loss, you have managed your risk correctly. Never rely solely on electronic triggers to stop your losses.
Managing Timeframe Overlaps
Traders often open short-term and long-term positions on the same asset or correlated assets. This creates a hidden layer of risk. You might feel safe because the setups seem unrelated, but both positions ultimately respond to the same underlying macro drivers. A long-term trade requires a wider stop, which consumes your daily loss room faster than a tight scalp.
Imagine a hypothetical situation where you have a long-term position in a gold ETF and a short-term scalp on gold futures. Both trades hinge on the same interest rate news. You might think the short-term trade has no impact on the long-term one. However, if the news causes a sharp price dip, both positions will hit their stops together, resulting in a combined loss that exceeds your daily limit.
Treat all timeframes as one block of risk for the same macro driver. If you have a long-term bias, your short-term scalp should count against the total allowance for that specific asset. This prevents you from inadvertently layering risk on a single market view. It keeps your overall account exposure stable regardless of how you hold the position.
Periodically clear your mental slate and view your entire open portfolio as if you were starting fresh today. Ask which positions you would keep if you had to pay a fee to open them again. This helps you identify if you are holding overlapping trades simply because you are already in them. If you would not open them both now, you should probably close the smaller one.
Use a simple tracking sheet to log your total exposure by theme across all timeframes. Sum up your risk for every position linked to the same driver, regardless of your intended holding period. This gives you a clear snapshot of your vulnerability. If the total number looks too high, you have your answer on whether to hold or fold.

Improving Execution Discipline
The urge to stack correlated trades often comes from a desire to maximize profit on a correct call. When a market starts moving your way, it is tempting to enter a second or third correlated position to catch more upside. This is the moment you must enforce your rules. Adding to a winning trade is fine, but adding to a correlated trade is just increasing your downside.
Consider a hypothetical example where you are long in the DAX index and it starts to rise. You feel confident and decide to enter the Euro and a German banking stock. Now you are effectively long the German market three times over. If the market reverses, your profit on the DAX might be wiped out by the losses on the other two positions combined.
Stick to your initial plan for each trade. If your strategy dictated a certain size for an idea, adding more correlated positions is a violation of that strategy. It changes the risk profile you calculated at the start. Stick to your original entry and only adjust if your thesis changes. This keeps your trading process consistent.
Implement a waiting period between opening correlated trades. If you open one position, force yourself to wait at least 1 hour before considering another related asset. This pause breaks the emotional momentum that often drives traders to over-expose themselves. It gives you time to see if the first trade actually works before you commit more capital.
Review your closed trades specifically to see if you were 'chasing' your own wins by opening related positions. If you find a pattern of this, acknowledge it as a behavioral error. Adjust your future workflow to prevent it. Being an independent trader means controlling these urges through rigid, simple rules that you follow every single day.
Final Takeaway
Correlation management is fundamentally about limiting the loss of a single market idea even when that idea is spread across several different tickets. Counting your trades as separate entities is a mistake that hides the true risk level of your account. In a prop firm challenge, you must ensure that your total risk exposure to any single macro theme stays well within your daily loss limit. If you treat each position as a separate entity, you will eventually find yourself with too much risk tied to one event.
A smaller, clearly measured exposure level is the best way to handle the inherent uncertainty of market relationships. When your chosen theme is already full, the disciplined choice is always to pass on the next related trade, regardless of how attractive it looks. By maintaining a buffer, you ensure that even if your assumptions about correlations are wrong or if an unexpected market event occurs, you have the room to survive the volatility and continue moving toward your goals.